
It can be simple to forget that we view market fluctuations via an aggregated, market-capitalisation-weighted lens. In actuality, the fortunes of various stocks and sectors may vary greatly over the short and long durations. Look at the chart below to see how diversely distributed US stock results have been in Q1 2023 (as of the end of April 2023). The S&P 500[1] was up about 9% in USD terms (4% in GBP terms due to the strengthening of the pound against the US dollar).
90% of the market growth in the first quarter of 2023 was attributable to the top ten performers, with Apple, Microsoft, and Nvidia accounting for 50% of the growth. Although the market declined by about 18% in 2022, the top ten corporations by size combined had a 37%[2] decline.
Figure 1: Individual US stock returns differ widely (01/01/23 to 30/04/23)
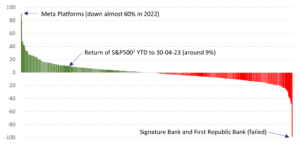
Note: (1) This represents the return of the Vanguard S&P500 ETF in USD. Holdings data from Morningstar Direct © All rights reserved.
The unwary may be tempted to believe that picking stocks is simple due to a combination of recency and hindsight biases (e.g., “It was obvious that Meta would rebound after last year’s plunge in share price!”). Nothing could be farther from the truth.
Active investors, who try to outperform the market through stock selection, lick their lips at the opportunities presented by charts like the one above. However, there is no assurance that they will outperform the market or even provide a return that matches it.
On the other hand, passive investors, who think that markets efficiently factor in all available information into pricing, are aware of the risks associated with selecting the wrong stocks and missing out on the returns that the market, as a whole, delivers. They can approximately and with a high degree of certainty capture the market return.
‘Do stocks outperform treasury bills?’[3] was a research report published in 2018 that had a unique result of being cited as support for both the active and passive sides of the investing argument. He noted that the top 1,000 stocks, or less than 4% of all of the stocks that have ever traded on the US stock exchanges, were solely responsible for the US$32 trillion of value created in the US market between 1926 and 2015. A subsequent report[4] that concentrated on non-US markets discovered that less than 1% of businesses were responsible for all wealth creation between 1990 and 2018 and more than 60% of all stocks failed to produce returns greater than those of US T-bills. The author states (in his original paper):
‘Not only does diversification reduce the variance of portfolio returns, but non-diversified portfolios are subject to the risk that they will fail to include the relatively few stocks that, ex-post, generate large cumulative returns. Indeed the results help to understand why active strategies, which tend to be poorly diversified, most often lead to underperformance.’
The task of designing a highly active, concentrated portfolio to try to identify and capture the returns of these few wealth-generating firms is immense, and it risks both hubris and a lack of humility regarding the power of the collective market view (‘it’s all in the price’). The active management sector has a very poor track record of delivering on its promise to outperform the market, with over 95% of firms failing to do so for 20 years [5].
If a person believes markets are efficient, they can easily invest in a low-cost, highly diversified systematic fund (of which index funds are a subtype) and capture the market return.
Referring to the late, great John C. Bogle, who founded Vanguard:
‘Don’t look for the needle, buy the haystack!’
Other blog posts you may find interesting:
Continue your search with other blogs below:
[1] This represents the return of the Vanguard S&P500 ETF in USD
[2] Nasdaq, (2023) Top 10 Names in S&P 500 Responsible for 90% of Q1 Gains, April 05. https://www.nasdaq.com/articles/top-10-names-in-sp-500-responsible-for-90-of-q1-gains
[3] Bessembinder, H. (2018) Do stocks outperform Treasury bills? Journal of Financial Economics, vol. 129, no. 3, 440–457. https://doi.org/10.1016/J.JFINECO.2018.06.004
[4] Bessembinder, H. (Hank), Chen, T.-F., Choi, G. and Wei, K.-C. (John). (2019), Do global stocks outperform US treasury bills? SSRN Electronic Journal. https://doi.org/10.2139/SSRN.3415739
[5] SPIVA | S&P Dow Jones Indices. (2022) https://www.spglobal.com/spdji/en/research-insights/spiva/spiva-library/